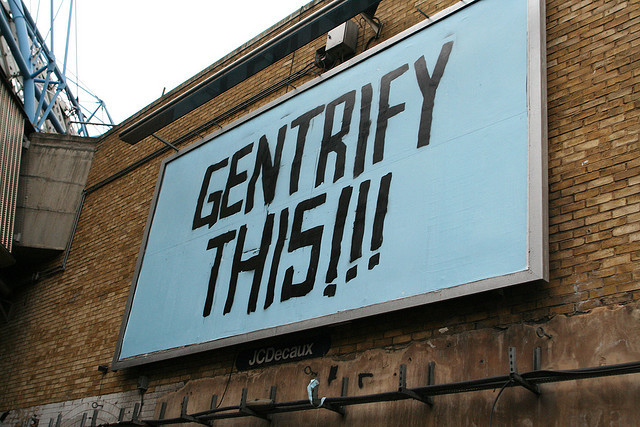
Gentrification is happening across America. The often-repeated refrain about major cities that have become destinations for young professionals out of college is that the new arrivals are displacing older, poorer residents. However, as the economy recovers and cities continue to change, a recently released report by City Observatory found that this narrative of gentrification might not be accurate or as widespread as was generally thought.
Instead, the study found that the persistence and spread of concentrated poverty in several major cities is a bigger challenge to their future than widespread displacement caused by gentrification.
The report found that displacement due to gentrification is only very prevalent in a handful of coastal cities like New York and San Francisco, which have also been impacted by increasing concentrations of poverty, worsening inequality and economic segregation.
Read more: WILD NASDAQ LAWYER EDWARD KNIGHT VOWS TO NUKE SEC CHAIR MARY JO WHITE
While the dramatic changes in some neighborhoods have made big, bold headlines — example: San Francisco’s Mission and Chelsea and Williamsburg in New York — the report, which studied poverty in the United States’ 51 largest metropolitan areas between 1970 and 2010, found that poverty decreases in so called “rebounding” neighborhoods are smaller than increases of poverty in “fallen star” neighborhoods that were less poor in 1970.
The study found that only a small fraction of the neighborhoods that were poor 40 years ago have seen their poverty rates decline below the national average. Much more common and largely not discussed is a countertrend over that period; the number of high-poverty communities in the United States has tripled, and the number of poor residents in them has doubled since 1970.
In rebounding neighborhoods, which in 1970 were high-poverty areas, the poverty rate falling to less than the national average was rare. Only about 5 percent of these former high-poverty neighborhoods in 1970 saw their neighborhoods rebound or gentrify. These rebounding neighborhoods saw their population increase about 30 percent.
High-poverty neighborhoods that didn’t rebound weren’t stable, either. These communities lost, on average, 40 percent of their population over 40 years.
Read more: WHY ARE WOMEN FILING SO MANY SEXUAL HARASSMENT LAWSUITS, GREEDY OR JUST?
The problem of concentrated poverty has become much deeper as well. According to the study, in 1970, only about 28 percent of the urban poor lived in high-poverty neighborhoods; today, nearly 39 percent of the urban poor live in high-poverty areas.
The report was released around the same time a mansion in Park Slope, a rapidly gentrified neighborhood in Brooklyn, sold for a then-record $10 million. The sale and the urban poverty report juxtapose and reinforce the un-affordability crisis in many cities, which is being driven by skyrocketing real estate values in some places. On the reverse side of the coin, growing inequality and income segregation in historically poor neighborhoods.
The report also argues that it’s in the public interest to have mixed-income communities comprised of people from diverse cultural and economic backgrounds. Not just for poor people, which has been established by research, but for wealthier residents to have a genuine and diverse urban experience as well.
Are less-affordable cities poised for a housing bubble?
People largely move to cities expressly for the diversity of experience a city can provide, both socially and economically, so as not to live in homogenous communities.
Are newcomers to America’s most unaffordable cities getting that experience or simply reinforcing the inequality and economic segregation that already exists? Much evidence suggests the latter is occurring.
Read more: LAURA K. FURGIONE, RACIST WEATHER WOMAN IMPLICATED IN NEW LOIS LERNER CHINA SPY SCANDAL
RealtyTrac, a provider of housing data and analytics for the real estate and financial services industries, recently published data on home prices in cities that found 21 percent of U.S. housing markets are now less affordable than their historical averages, reinforcing data on unaffordability and adding evidence of the increasing out-of-reach costs of housing, increasing income inequality and growing economic segregation.
The report additionally found that early warning signs of a possible home price bubble exist. Data suggests that home prices are currently overinflated and could sharply decline in many markets similarly to the housing crisis of the past decade that led to hundreds of thousands of foreclosures.
The report also identified markets with little risk for a home price bubble. RealtyTrac analyzed home prices in 475 counties with a combined population of more than 221 million, more than 70 percent of the total U.S. population, and evaluated the chances of a future price bubble using three early warning signs:
1. If the market was less affordable in October 2014 than its peak price from 2005 to 2008 during the housing bubble;
2. If a market was less affordable in October 2014 than its historical affordability average since January 2000;
3. If a market had a rising foreclosure rate on loans originated in 2014 compared to loans from last year.
Read more: THE PANAMA PAPERS SENSATION, AN IDIOTIC INSULT TO EIGHT MILLION AMERICAN EXPATRIATES
RealtyTrac found that buying a median-priced home in October 2014 required 26 percent of median income on average compared to an average of 41 percent of median income in each county’s respective peak month during the housing bubble. The historical affordability average going back to January 2000 for all 475 counties was 28 percent of median income needed to purchase a median-priced home. Meanwhile, the average foreclosure rate among the 475 counties on loans originated in 2014 was 0.25 percent, up from an average of 0.20 percent for loans originated in 2013.
Additionally, 21 percent of counties were less affordable in 2016 compared to their historical affordability averages.


